
Plugster
UI foundation that keeps product behavior modular and maintainable.
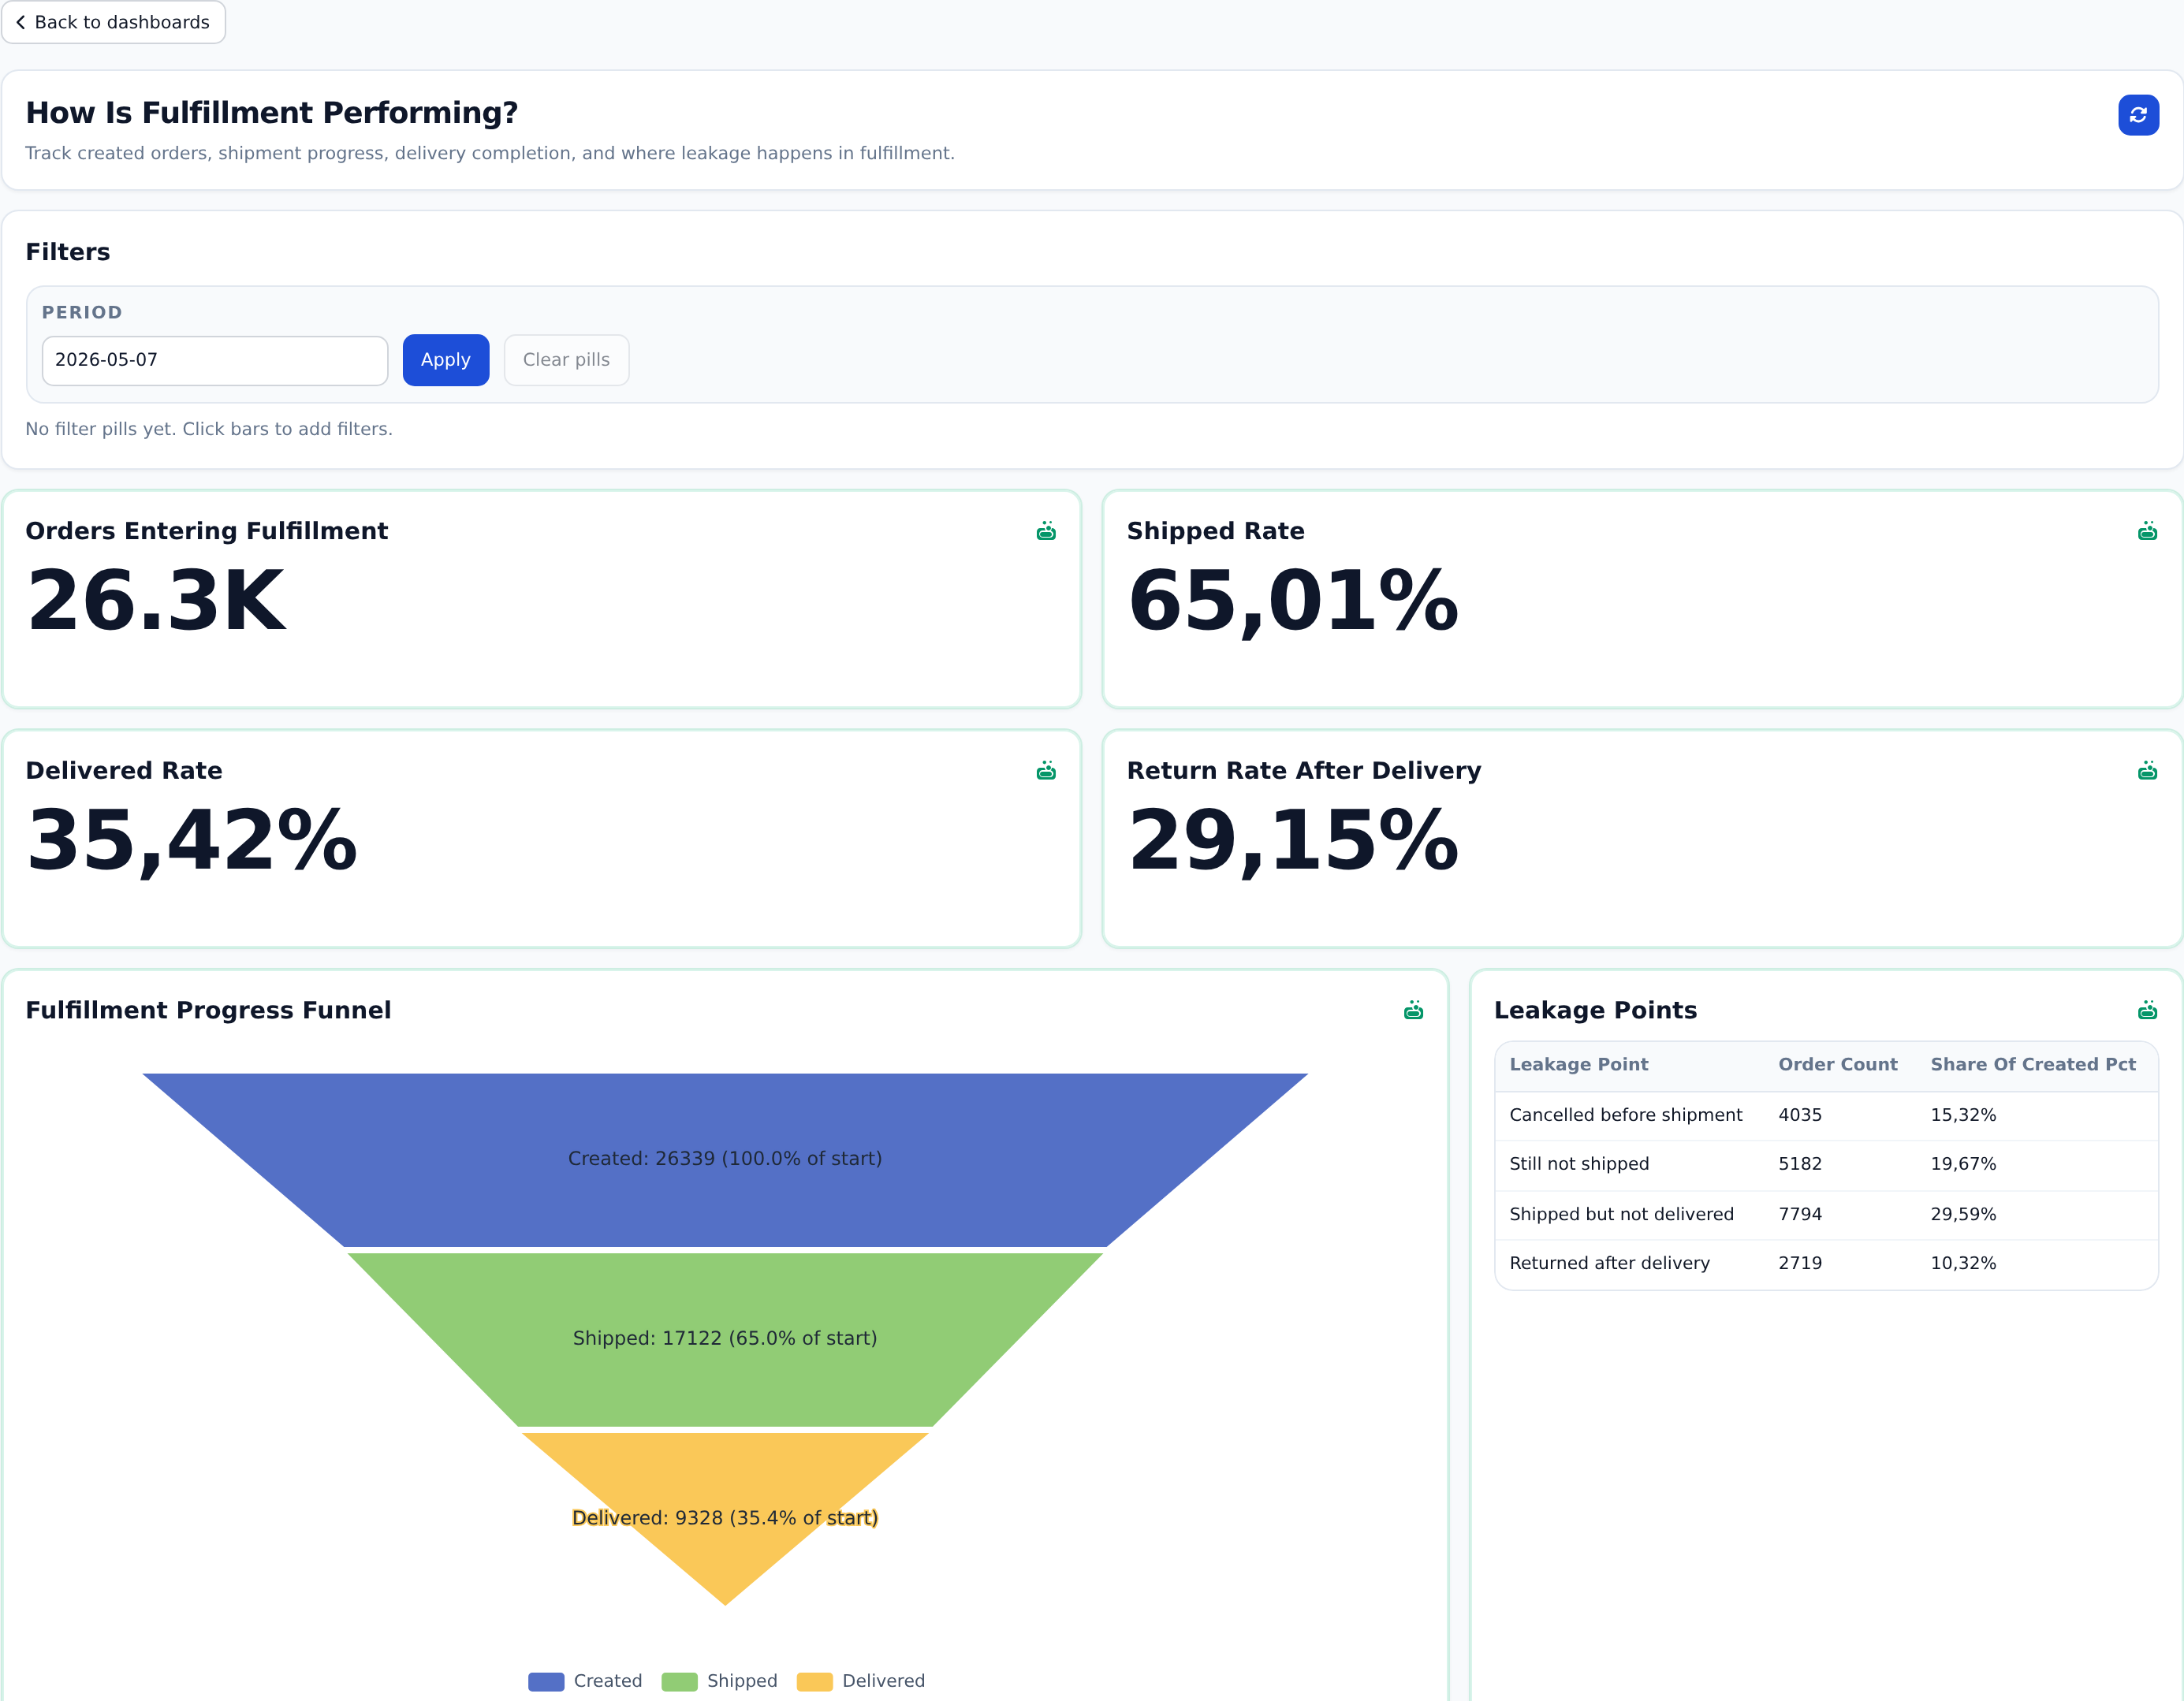
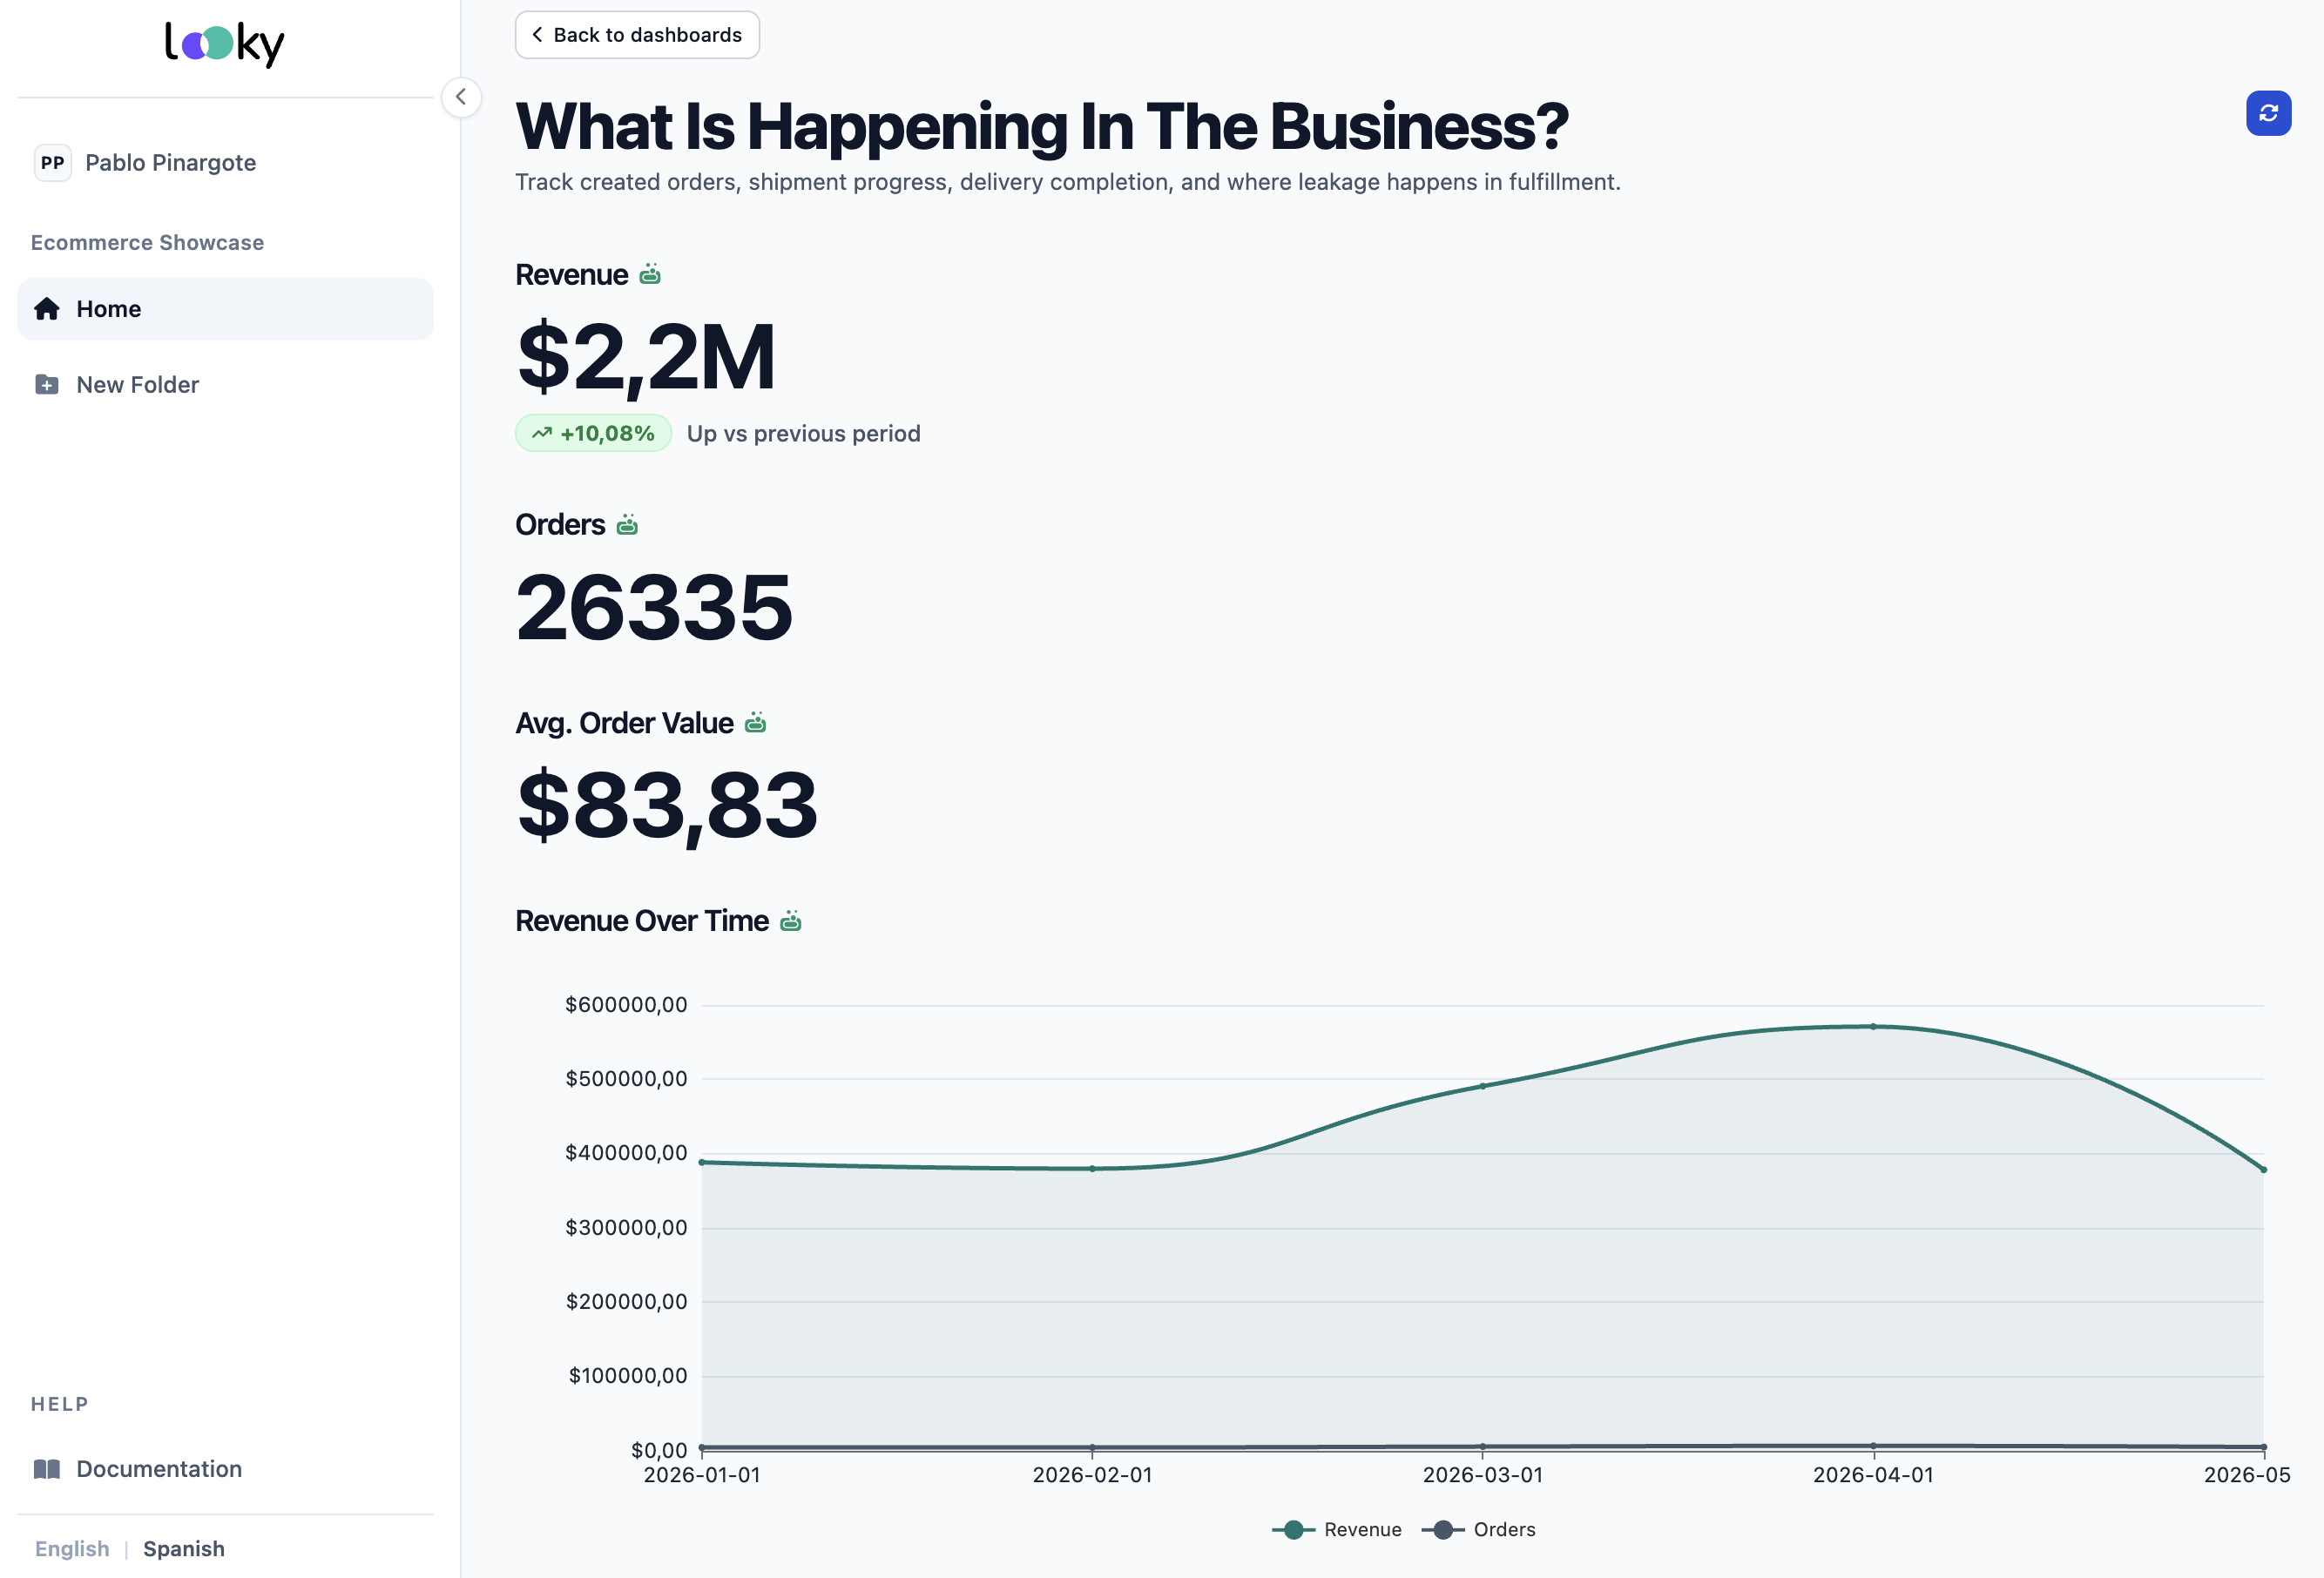
Looky helps one team deliver interactive dashboards for exploration, guided reports for managers, and polished KPI briefs for leadership, all from one controlled analytics workflow — built so your coding agent authors it from the docs, and your analytics engineer reviews and publishes.
Your coding agent authors models, visualizations, and dashboards from the docs; your analytics engineer reviews, validates, and publishes. Metrics are defined once and reused everywhere — reliable outputs without rebuilding the same logic in multiple tools. Looky keeps reporting delivery structured and repeatable so requests move faster.
See the publishing flow →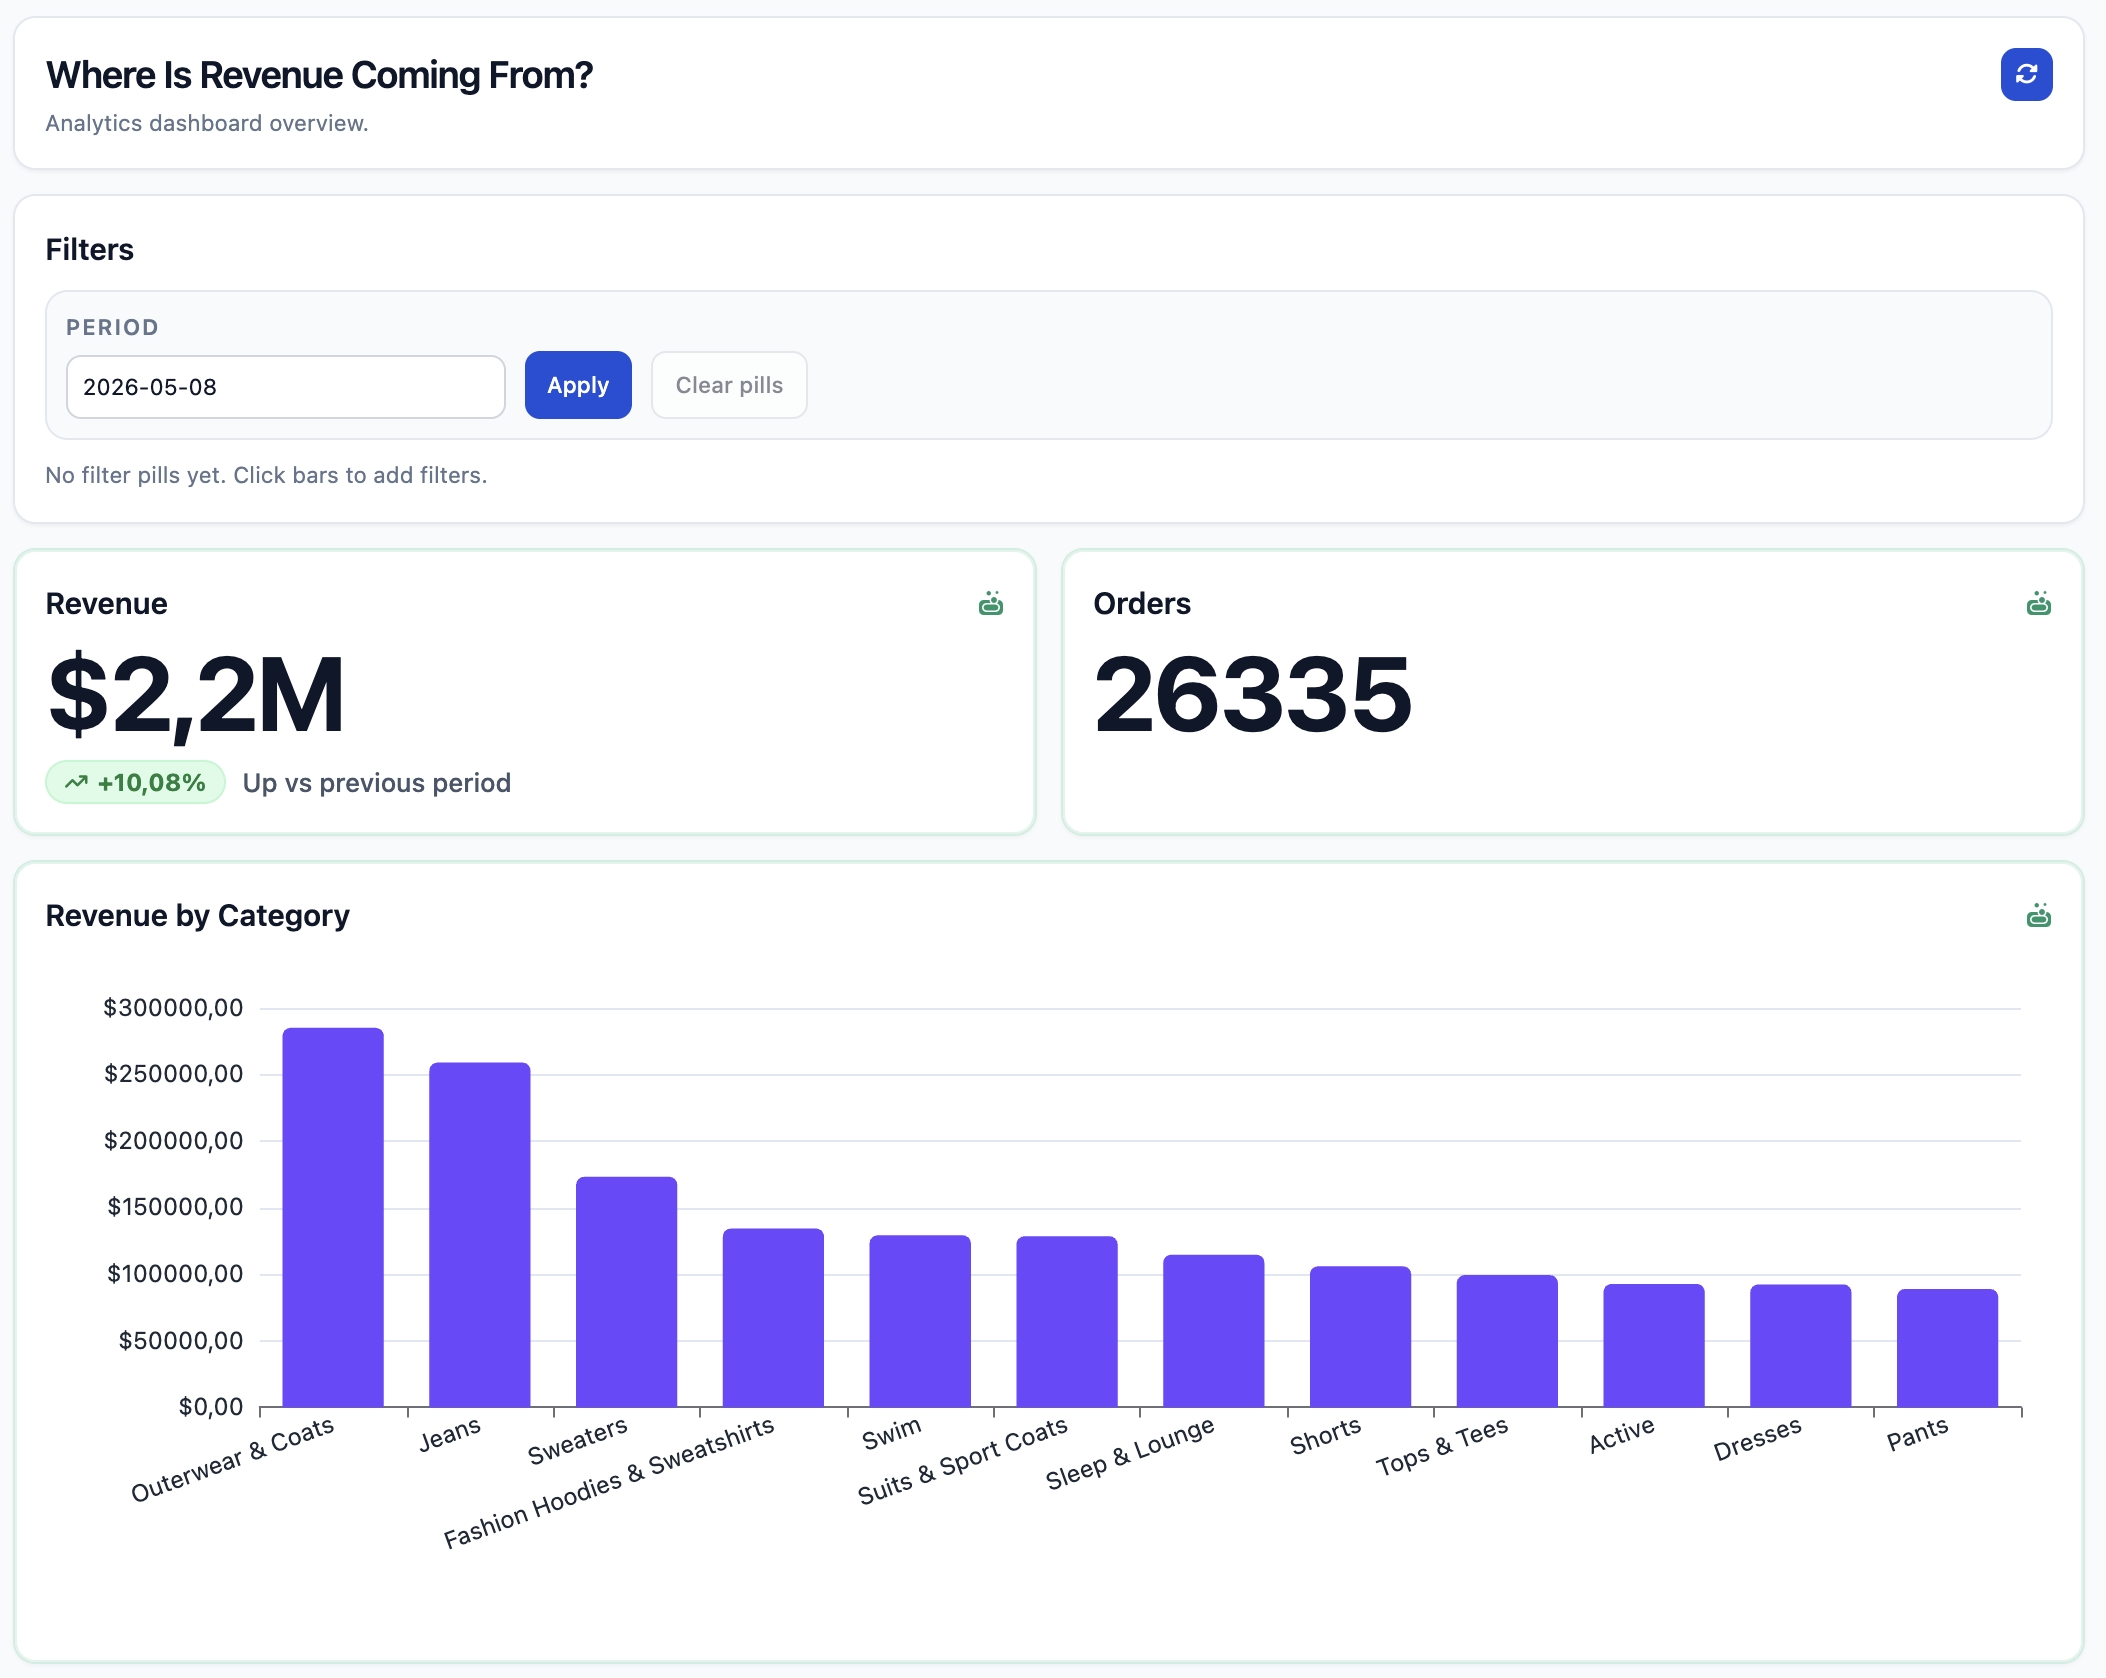
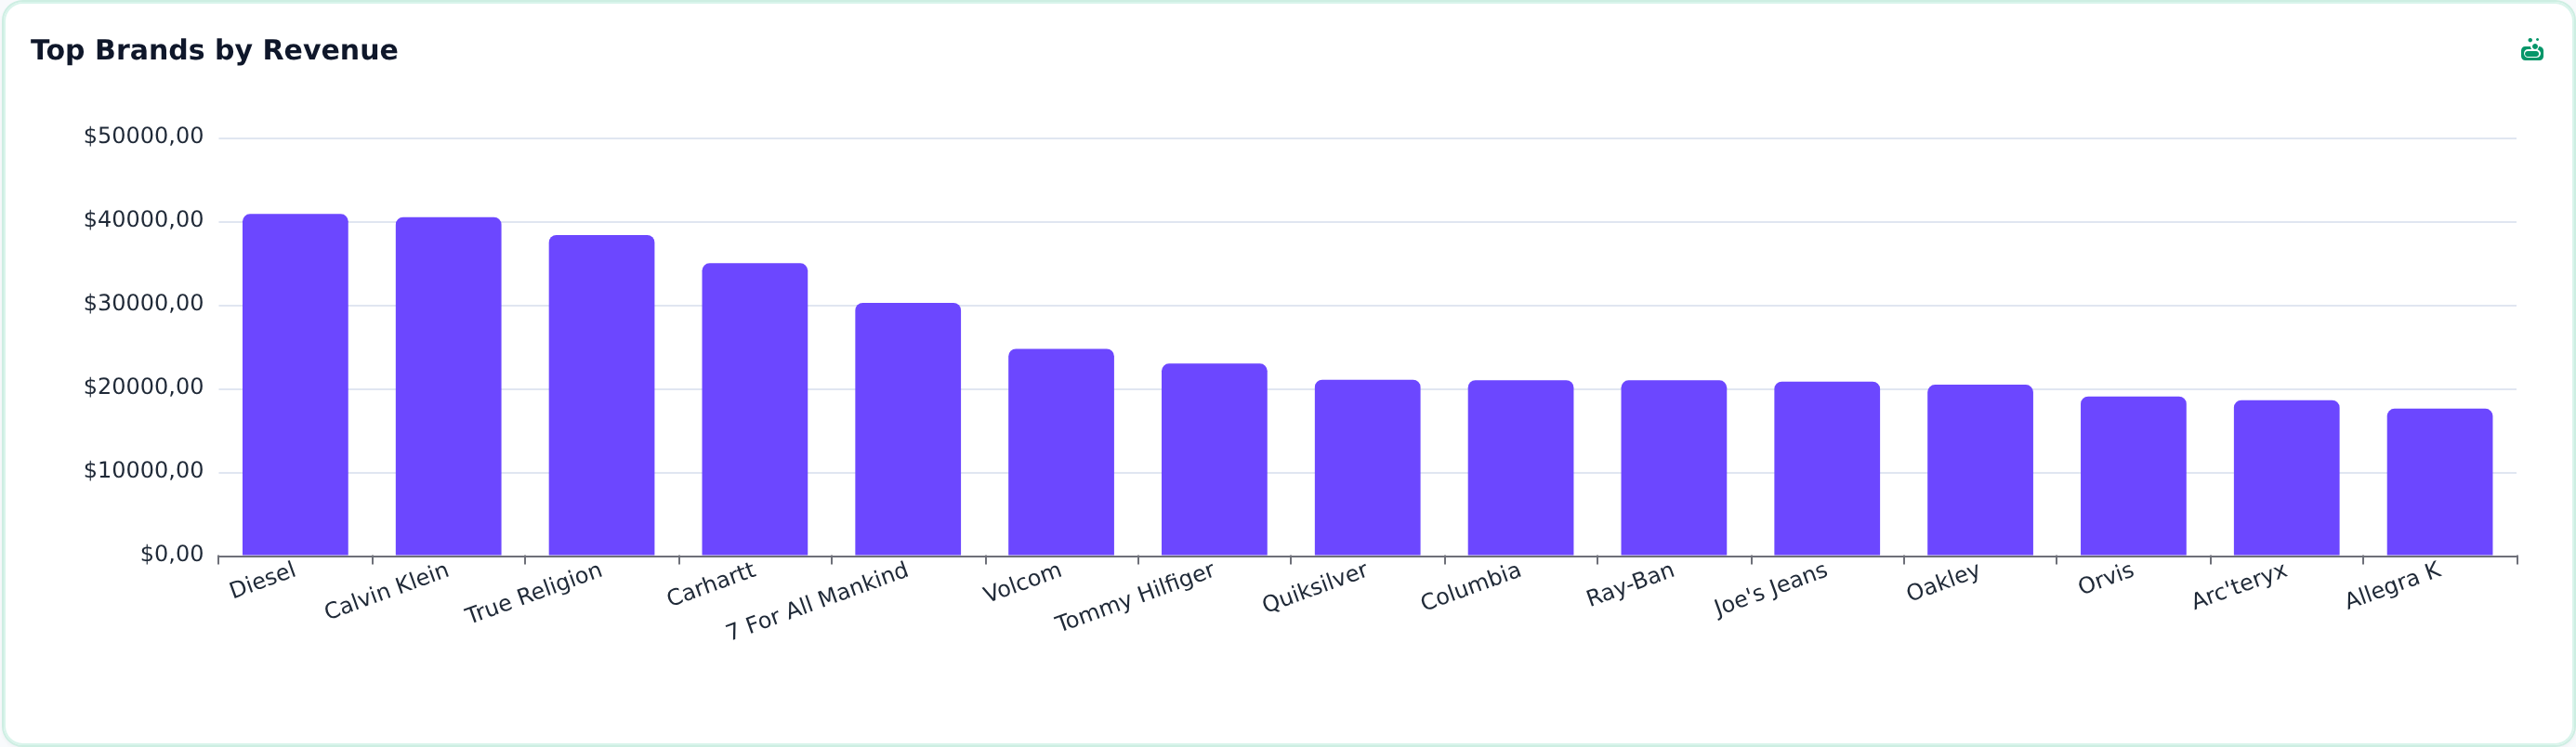
Some audiences do want to explore. They need filters, comparisons, and guided dashboards, but they should never have to build them. Looky gives them useful navigation without exposing the construction burden behind it.
See who Looky is built for →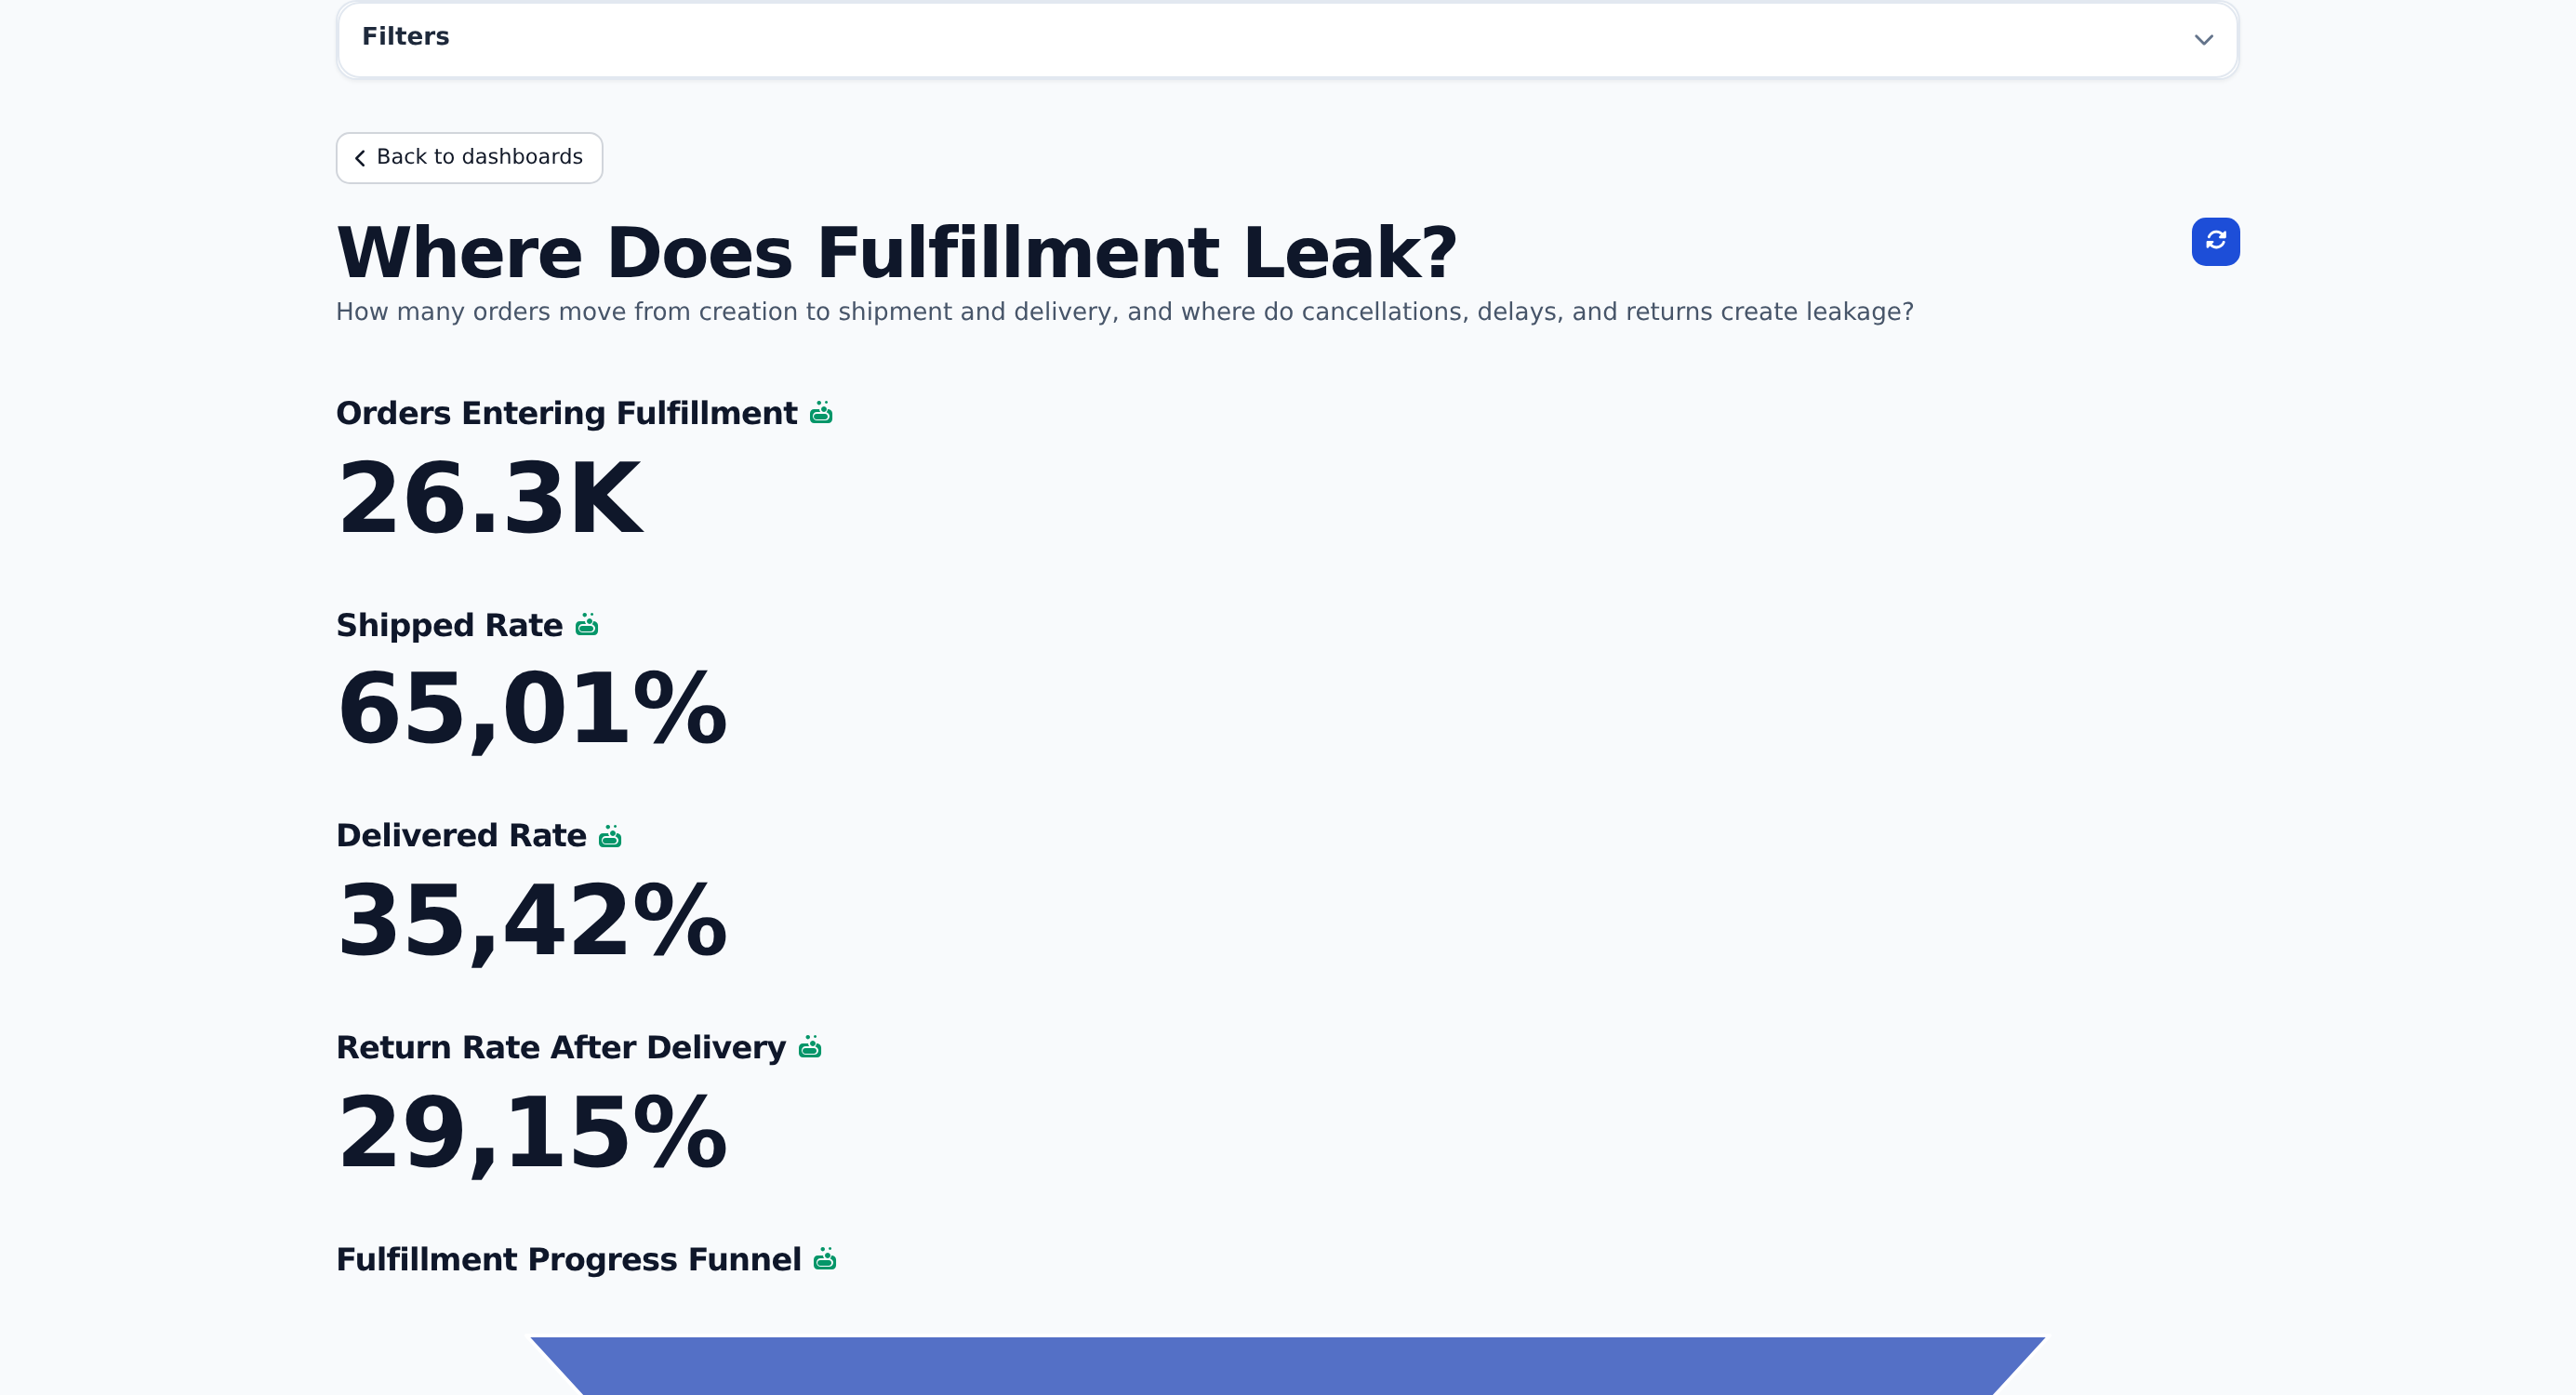
Not every audience wants another login. Many just need the monthly number, the trend, and a concise narrative in their inbox. Looky supports that behavior too, without creating a separate reporting process.
Looky gives one team a consistent way to deliver dashboards, reports, and executive briefs without splitting the work across separate tools and workflows.
Understand the model →When the real work already lives in shared logic and business rules, recreating it in every dashboard becomes waste. Looky keeps reporting delivery structured so teams can move faster with less rework.
The audience that wants to navigate data gets dashboards and filters, but not the burden of constructing or maintaining the experience.
Some stakeholders just want the answer delivered cleanly. Looky lets you generate document-style outputs and scheduled updates from the same governed reporting flow.
Our belief
No matter how polished the summary or KPI, looking closer always reveals something. Looky isn't only about drill-down — it's also about drill-up: finding the questions you didn't know you had. That's why we build to answer questions, not to run complex simulations.
AI-ready by design
Your analytics are code — models in Malloy, visualizations and dashboards in YAML — and the docs ship as
llms.txt. So your own coding agent has the full authoring contract and drafts real content from it;
your analytics engineer reviews, validates, and publishes. Built to be authored by your agent, governed by
your team.
Your coding agent drafts models, visualizations, and dashboards from the machine-readable docs; your analytics engineer reviews, validates, and publishes. Business logic, definitions, and reporting rules live in one place — defined once, reused everywhere — so the team is not rebuilding the same answer in multiple tools.
Publish charts, tables, KPIs, dashboards, and reports through a predictable delivery flow that keeps reporting easier to manage.
Interactive dashboards for exploration, guided reports for managers, and scheduled briefs for leadership. One platform, different consumption modes.
Built with
Looky stays intentionally compact. These are some of the core technologies behind governed analytics, controlled publishing, and interactive delivery.
UI foundation that keeps product behavior modular and maintainable.

Publishing foundation for multilingual pages, content management, and controlled deployments.

Modeling layer used to keep shared metric definitions and governed analytics logic close to the data.

Charting engine for interactive visualizations and export-friendly analytical views.
Talk to us
Questions about Looky, a demo, or a quote for your team? Tell us what you need and we'll get back to you.
We've received your request and we'll get back to you at the email you provided.
You'll get an email shortly with your invitation to create your account. Double-check the email you entered is correct: that's where we send your invitation and your sign-in codes.